I have done an initial experiment on the diffusion of food coloring in Knox unflavored Gelatin. I stirred 5 ml of gelatin into 250 ml of warm water in a measuring cup and then heated the solution for 90 seconds in a micorwave oven. After stirring again I poured most of it into 6 90mm Petrie dishes using a straw as a guide and then chilled the mix in the refrigerator for a few hours. My first attempt to let the food coloring gel to diffuse failed because I left it sitting on the light box and it ended up liquifying again. On my second trial I used a tooth pick to poke little globs of coloring gel into the gelatin and returned the dish to the refrigerator. For this experiment I used FD&C blue 1 from a tube of Betty Crocker Classic Gel Food Colors also contains FD&C red 40 and FD&C yellow 5.

I checked the Petrie dish some time later and the spots of dye showed a noticable amount of diffusion. So I made my first observation which was the image above. I cropped the original 1600 x 1200 image to obtain to get a 150 x 150 image of the lower right spot.


edit: There was a typo in the expression for the expected value of the one dimensional diffusion case. I had initially used λ squared as the divisor in the exponent of the Gaussian function. It's now been fixed. One could call the standard deviation the "deviation length."

I checked the Petrie dish some time later and the spots of dye showed a noticable amount of diffusion. So I made my first observation which was the image above. I cropped the original 1600 x 1200 image to obtain to get a 150 x 150 image of the lower right spot.
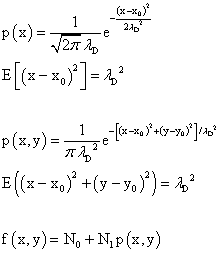
To analyze the results we need some math. For a one dimensional problem the probability distribution function is p(x). This is also known as a Gaussian function. When one calculates the expected value of the square of the deviation from the central value one gets "σ squared" which is the square of the diffusion length. This turns out to be half the devisor in the exponent of e. The numerical factor in front is needed so that the total probability is equal to 1. Again, starting with a Gaussian function for the 2 dimensional case one finds that the expected value of the square of the deviation from the central point. This time it turns out to be just "σ squared" or the square of the diffusion length and so we set this value equal to the disivor in the exponent of e and need a different numerical factor so the total probability equal to 1. One has to add a constant term and multiply the probability distribution by a numerical factor in order to fit the image of the diffused blue dye. The formula below was used.

The red portion of the image is the least responsive to blue light so I subtracted the values of the pixels from 255 to get a measure of the absorbtion of the light. The 3D surface plot of the altered R values, R', shows a Gaussian distribution. This distribution was used to obtain a fit to the data. The results are shown above the surface plot.

The x and y values in the image are numbers which give the location of the pixels. To convert the diffusion length into a distance measure on has to use the width of the Petrie dish to obtain a conversion factor. The diameter of the innermost ring of the bottom of the Petrie dish was 83.5 mm which corresponded to 968 pixels. This gave a value for the conversion factor of 86.26 nm/pixel.
edit: There was a typo in the expression for the expected value of the one dimensional diffusion case. I had initially used λ squared as the divisor in the exponent of the Gaussian function. It's now been fixed. One could call the standard deviation the "deviation length."

No comments:
Post a Comment