Tuesday, August 31, 2010
NIO's Observer Function

Sunday, August 29, 2010
NIO Does a Little Stargazing.
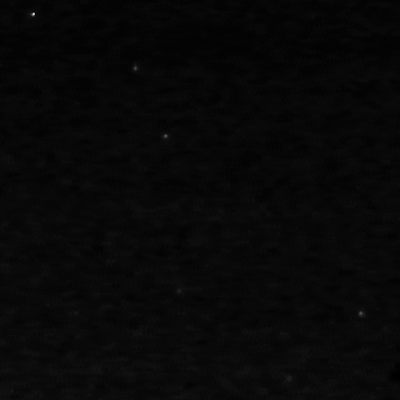
The stars were brightened relative to the background using a power law with the power, p, equal to 1.6. You may have to click to enlarge the photo to its original size.
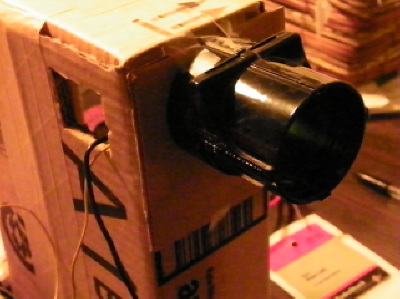
The Effect of a Diffuser in Front of the LED
The LED's Luminous Emittance
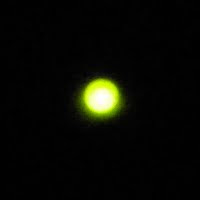
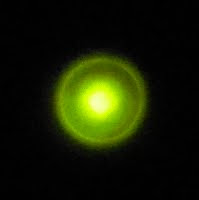
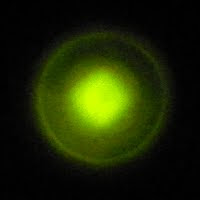
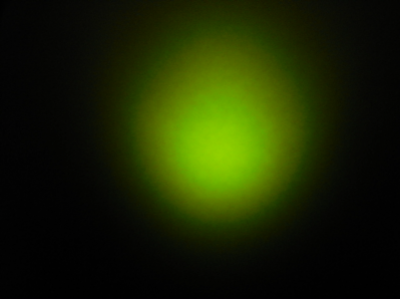
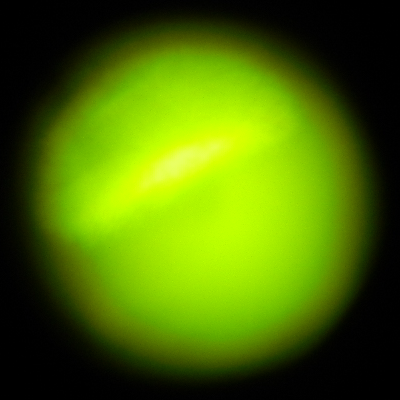
There seems to be a "halo" which surrounds the brighter center of the pattern and grows linearly with distance.
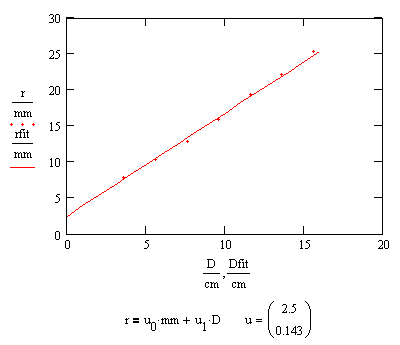
The edge of the halo marks a cone which bounds the emitted light. The angle between the lines common to a plane cutting the light cone in half and the light cone is 18°. At larger distances the central pad where the whisker makes contact interferes with a uniform distribution of light.
Saturday, August 28, 2010
A Standard Candle?
Friday, August 27, 2010
Summary of the Characteristics for the RadioShack 5mm Green LED
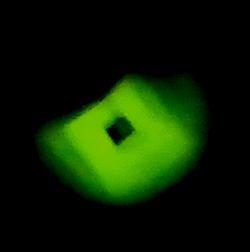
A Peek Inside the LED
Thursday, August 26, 2010
Relative Luminance vs Current
Wednesday, August 25, 2010
The Green LED's Spectrum

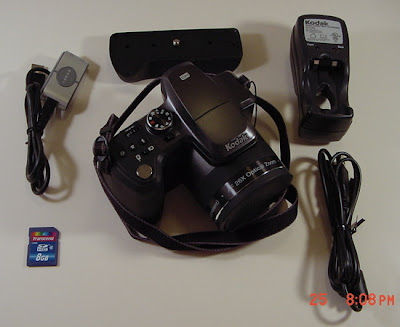
New Observer Onboard
Tuesday, August 24, 2010
Equivalent Circuit for an LED
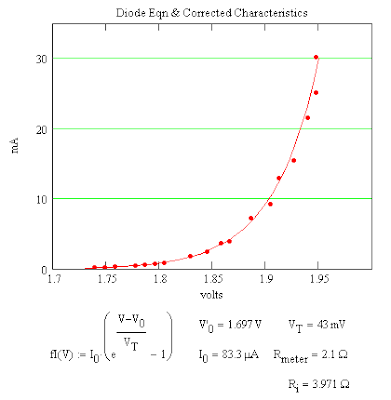
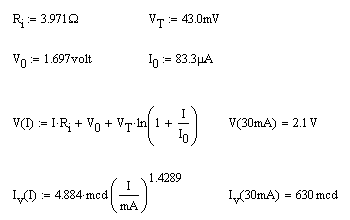
The results suggest the following equivalent circuit for a real diode. There appears to be an interval voltage source, V0, an ideal diode characterized by I0 and the thermal voltage and an internal resistance.
Monday, August 23, 2010
Comparison of the LED Characteristics With the Diode Eqn
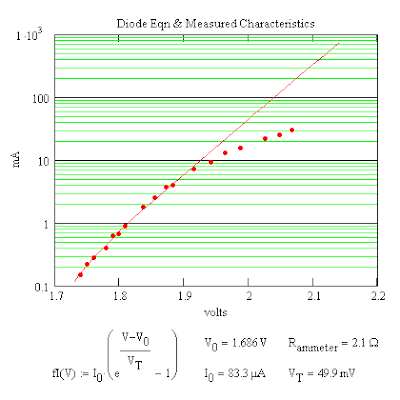
I do not know why V0 is needed. It could be that light produces a contact electrification of the junction in the LED.
Sunday, August 22, 2010
Measuring the Characteristic Curve for an LED
While waiting for the repairs to be done I picked up some LEDs at RadioShack. There wasn't much information on the LEDs except forward voltage 2.1 V, current 30 mA, luminous intensity 630 mcd, and wavelength 565 nm. So I tried to measure the characteristic curve using two 1.5 V AA batteries, a resistance box and a digital multimeter to measure the current but the curves proved to be useless even though I corrected for the voltage drop across the resistance box. I decided to get a second digital multimeter and this time measured both the voltage across and current through the LED. The results were better.

Limits of Detectability
One encounters similar problems with human perception. For the eye the limit is the dark adaption threshold. At low light levels an image becomes pointilistic and scintillating. The eye is not equally sensitive to all colors of the same intensity and this is the subject of colorimetry.
Friday, August 20, 2010
Recommended Reading
Petroleum in the Marine Environment: UV Fluroescence Spectrometry
Laser Experiments for Beginners by Richard N. Zare
What Would a Critical Analysis of the Oil Spill Require?
Rep. Markey asked for a formula used in the oil budget calculator. Fluorescence spectroscopy which was used to measure the concentration of the oil near the well falls under the domain of Quantum Electrodynamics. To determine the transition rates one needs to know the oscillator strength function which is related to the Einstein coefficients. One might be able to adjust the spectroscopy data by subtracting the distribution for Rayleigh scattering to arrive at a better estimate. A study of Raman scattering might confirm results. The analysis requires expert knowledge.
Thursday, August 19, 2010
The Scattering of Light by Small Particles
An interesting effect is that of critical opalescence which can be seen in this YouTube video.
Gulf Oil Spill & Seafood Safety Committee Hearing
The seafood sampled were deemed to be safe for human consumption. The main concern was the presence of polycyclic aromatic hydrocarbons (PAHs). The Oil Budget referred to during the hearings indicates what happened to the spilled oil (summary). A more technical report discusses the Oil Budget Calculator about which Rep. Markey asked for more detail on the formulas used. These reports on which the discussion is based are part of a ongoing process conducted by a collaboration, the Joint Analysis Group and the conclusions are not yet final.
Saturday, August 14, 2010
Can We improve on the Digital Color Camera?

Friday, August 13, 2010
Using Exposures Instead of RGB Values
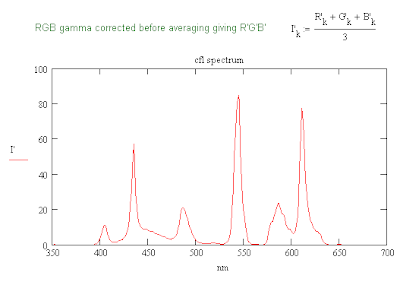 This plot suggests that the color temperature might be higher than data sheet indicated. It is similar to that of the "narrow band" illuminants F10-12 and seems to lie between F12 and F11. The bulb used was not exactly the same as those listed in the datasheet.
Thursday, August 12, 2010
CFL Spectrum with Gamma Correction
The plot above is for the same CFL spectrum found previously but with a gamma correction applied to the vertical scale. The relative heights of the peaks are probably dependent on the formula for converting the RGB values to a B&W value. The function that my computer uses to convert a color image to B&W shows a stronger response to the G values which one would expect since the eye is most sensitive to 555 nm. I probably need to look for a better conversion formula.
edit: The eye's response to light of different wavelengths is measured by the luminosity function. The RGB values are determined by the color matching functions. All four depend on the illuminant since the spectral power density is a function of wavelength. The conversion formula used may assume a standard illuminant.
Improving on the Accuracy of Your Spectrometer
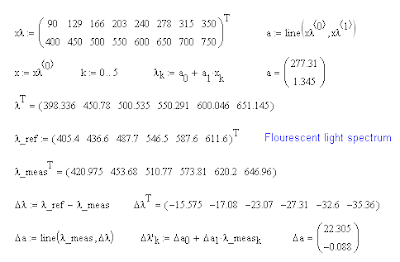
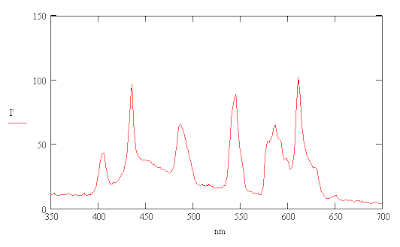
The errors in the positions of the lines ranged from about -15 nm to -35 nm depending on the value of the measured wavelength.
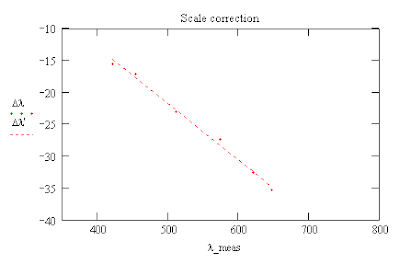
One can then use these formulas to calculate a corrected scale for the wavelengths of the mercury spectrum.
Tuesday, August 10, 2010
Adding Violet to the Spectrum
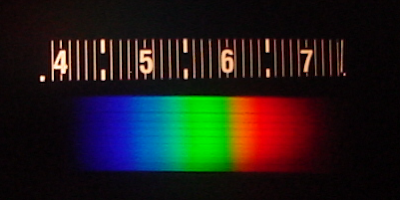
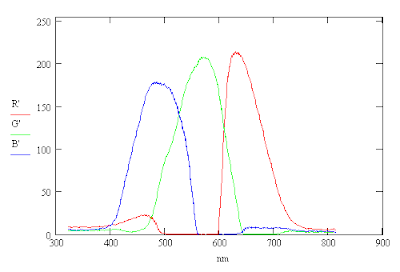
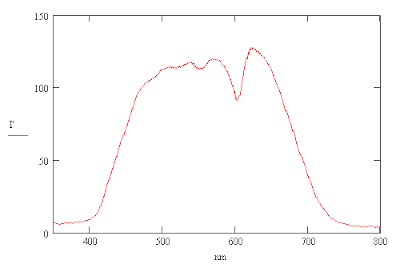
The reason appears to be that the camera is not sensitive enough to red light below a wavelength of 500 nm. Each pixel of an RGB image has values of R, G and B ranging between 0 and 255 for the colors red, green and blue respectively. One can add a synthetic violet to the image by replacing the R value by 4R if the B value is greate than the R value but only to those portions of the image that you want to correct. This effectively makes the R image more sensitive to violet light. The changes are shown below.
Friday, August 6, 2010
Two Steiner Problem and Soap Film Solution References
Initial Results on the Diffusion Experiment
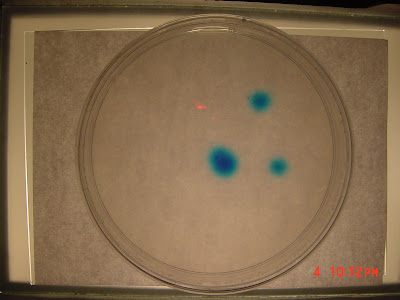
I checked the Petrie dish some time later and the spots of dye showed a noticable amount of diffusion. So I made my first observation which was the image above. I cropped the original 1600 x 1200 image to obtain to get a 150 x 150 image of the lower right spot.
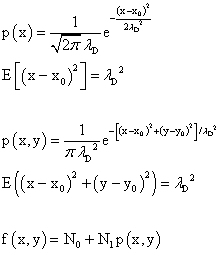
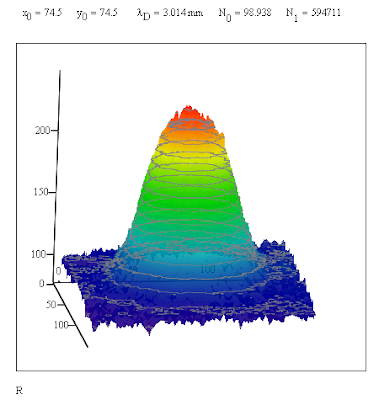
edit: There was a typo in the expression for the expected value of the one dimensional diffusion case. I had initially used λ squared as the divisor in the exponent of the Gaussian function. It's now been fixed. One could call the standard deviation the "deviation length."
Wednesday, August 4, 2010
Sony DSC S50 Response for Normal Exposure
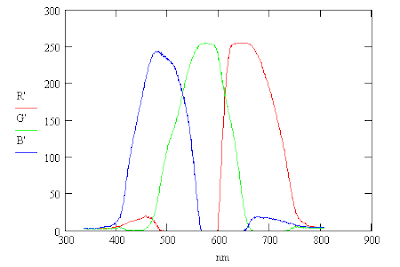
Note that the RGB response curves are clipped near the peaks giving a flatter response.

The result is that the intensity has two peaks in it corresponding to yellow and cyan which are brighter by nature. The colors red, green and blue are the corners of the color cube which are closer to black while yellow, cyan and magenta are corners closer to white and hence brighter. Physically the energy density at each wavelength in incandescent light is about the same for thermal radiation at 3000 °K and one would expect a similar response at all frequencies. The eye is most sensitive to green and one would expect a stronger response there.
The conclusion is that the camera does not respond in the same way to light that is underexposed as it does to a normal exposure. The colors in shadows may be shifted somewhat. One does not see the colors yellow or cyan in the underexposed spectrum. The underexposed images give a better indication on how the RGB filters work.
edit: Photopsins are the protein-pigment complexes which determine the human eye's response to light.
Tuesday, August 3, 2010
Sony DSC-50 Spectral Response to Incandescent Light

The camera setting were 1600x1200, autofocus, spot metering and EV -2.0 (bias) for which the camera selected f/4.0 at 1/60 sec. Averging the RGB pixel values vertically along the spectrum gave the following response curves from the red, green and blue images. The averaging helps smooth the curves.
These RGB curves can be used to compute the corresponding intensity curve, I.
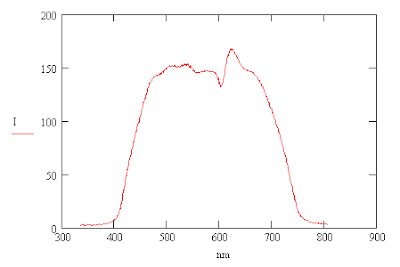
One can compute the intensity, I, from the RGB averages by using the following formula. The formula gives the same curve that one gets by converting the color image into a black and white image. Division by 3 is needed so that the intensity of white, R=255, G=255, B=255, is also equal to 255.

The light produced by an incandescent light bulb is primarily thermal radiation produced by a heated filament. The color temperature of the light is about 3000 °K and so it has more red light present than blue light. This may be why the red peak is higher than that of blue.
Monday, August 2, 2010
Other Mechanisms for the Dispersion of Oil
The big question now is how much oil was processed by each mechanism and what is still present in and on the water and above the its surface. The fraction of the oil present in the water will probably have a different biological half-life for different layers of the ocean. A long half-life would help better distribute the effects of the oil spill over time as well as distributing it over a large volume perhaps reducing bioamplification by allowing more time for the elimination of toxic substances.
edit: A question that should be asked under the circumstances of the oil spill is, "How can we buy time for an ecosystem?" Another path that some of the oil followed was the burn off on the ocean surface.


