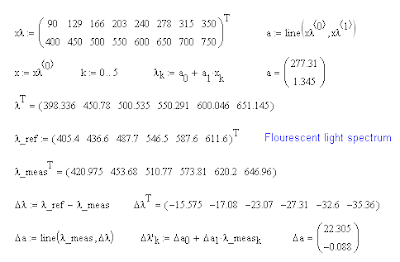
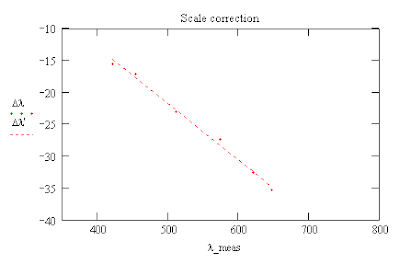
Using the scale of the spectrometer one can find a line which converts the horizontal number of the pixel, x, to a wavelength, λ, measured in nanometers. One can get the intensity of the lines by using the pixel values of a B&W image or convert the RGB values for each pixel using the formula* I = (R + G + B)/3 and then measure the x values of the peaks using the conversion formula to get measured values of the wavelenths, λ_meas. The reference wavelengths were obtained from a Wikipedia plot of the flourescent light's mercury (Hg) spectrum and these were used to obtain a formula for the corrections, Δλ, for the measured wavelengths.

The errors in the positions of the lines ranged from about -15 nm to -35 nm depending on the value of the measured wavelength.

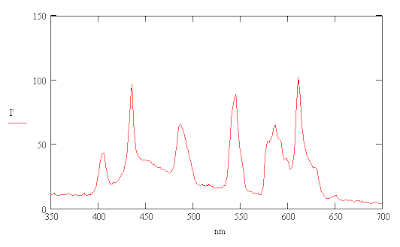
One can then use these formulas to calculate a corrected scale for the wavelengths of the mercury spectrum.


The errors in the positions of the lines ranged from about -15 nm to -35 nm depending on the value of the measured wavelength.

One can then use these formulas to calculate a corrected scale for the wavelengths of the mercury spectrum.

I was also able to compensate for a slight tilt of my camera relative to the spectrum by averaging along a line slightly shifted from vertical which improved the resolution enough to show an indication of the multiple lines just below 600 nm. This result can be compared with the spectrum for a CFL with a 3500 K color temperature in a Sylvania technical factsheet for their compact flourescent bulbs. Narrowing the slit of the spectrometer slightly by taping a thin piece of cardboard from the light bulb carton over it reduces the intensity of the spectrum and also helps to improve resolution slightly.
*This formula seems to be more accurate than the one previously used involving the squares of the RGB values.

No comments:
Post a Comment