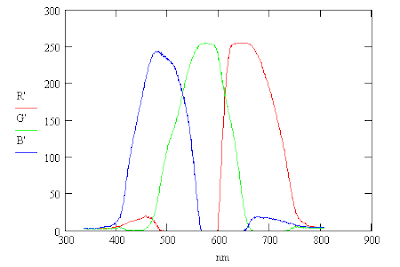
The camera setting were 1600x1200, autofocus, spot metering and EV -2.0 (bias) for which the camera selected f/4.0 at 1/60 sec. Averging the RGB pixel values vertically along the spectrum gave the following response curves from the red, green and blue images. The averaging helps smooth the curves.

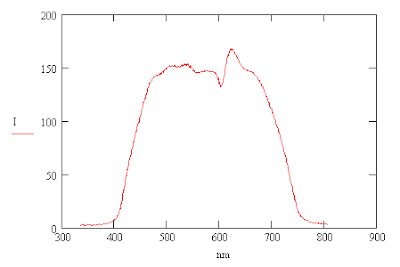
These RGB curves can be used to compute the corresponding intensity curve, I.

One can compute the intensity, I, from the RGB averages by using the following formula. The formula gives the same curve that one gets by converting the color image into a black and white image. Division by 3 is needed so that the intensity of white, R=255, G=255, B=255, is also equal to 255.

The light produced by an incandescent light bulb is primarily thermal radiation produced by a heated filament. The color temperature of the light is about 3000 °K and so it has more red light present than blue light. This may be why the red peak is higher than that of blue.
edit: (12 Aug 2010) I made an error here. The values of the B&W image are the average of the RGB components.
No comments:
Post a Comment