The old man clings to the past but tends to lose his grip on it over time. He is set in his ways and a ghost of what once was.
The new man is somewhat of a tyro who wants more but lacks perspective and so has a limited world view. He tends to be more adaptive but suffers from a lack of restraint due to an uncritical nature. Oversimplification leaves him prone to error.
Caesar was a new man who did not respect bounds and ended up with delusions of grandeur. Cicero, also a new man, recognized the need for moderation and balance. He was a rare breed who tried to see both sides but was not fully accepted by either side.
The Renaisance saw a re-emergence of the new man and the beginnings of the Reformation. The spirit of self-determination gained ascendency in northern Europe. In America too there was a break brought about by its treatment as a protectorate by a remote government. America was the New World and its people sought a new beginning. The Enlightenment with its progressive viewpoint had spurred change but the excesses of the French Revolution and the rise of Napoleon raised a lot of doubts.
Perhaps the best approach is that of the "regenerative receiver". He too is no longer satisfied with predetermined solutions and seeks a better picture by reworking the problem. In the process he acquires some knowledge of what is missing. Additional creativity allows one to go beyond what has already been accomplished. A broader perspective takes one beyond the here and now. But the wise man is also interested in bounds.
Wednesday, November 17, 2010
Jefferson on Education
Jefferson believed that public education was essential for a republic to function properly. The following passages are from The Portable Thomas Jefferson,
To George Wythe (Paris, Aug 13, 1786): "...I think by far the most important bill in our whole code is that of the diffusion of knowledge among the people. No other sure foundation can be divised for the preservation of freedom, and happiness."
Report of the Commissioners for the University of Virginia (Aug 4, 1818),
"...The objects of this primary education determine its character and limits. These objects would be,
To enable him to calculate for himself, and to express and preserve his ideas, his contracts and accounts in writing,
To improve, by reading, his morals and faculties;
To understand his duties to his neighbors and country, and to discharge with competence the functions confided to him by either;
To know his rights; to exercise with order and justice those he retains; to choose with discretion the fiduciary of those he delegates; and to notice their conduct with diligence, with candor, and judgment;
And in general, to observe with intelligence and faithfulness all the social relations under which he shall be placed."
"...Some good men, and even of respectable information, consider the learned sciences as useless acquirement; some think that they do not better the condition of man; and others that education, like private and individual concerns, should be left to private individual effort; not reflecting that an establishment embracing all the sciences which may be useful and even necessary in the various vocations of life, with the buildings and apparatus belonging to each, are far beyound the reach of individual means, and must either derive existence from public patronage, or not exist at all. This would leave us then without those callings which depend on education, or send us to other countries to seek the instruction they require. But the Commissioners are happy in considering the statute under which they are assembled as proof that the Legislature is far from the abandonment of objects so interesting. They are sensible that the advantages of well-directed education, moral, political and economical, are truly above all estimate. Education generates habits of application, of order, and the love of virtue; and controls, by the force of habit, any innate obliquities in our moral organization. We should be far, too, from the discouraging persuasion that man is fixed, by the law of his nature, at a given point; that his improvement is a chimera, and the hope delusive of rendering ourselves wiser, happier or better than our forefathers were. As well might it be urged that the wild and uncultivated tree, hitherto yielding sour and bitter fruit only, can never be made to yield better; yet we know that the grafting art implants a new tree on the savage stock, producing what is most estimable both in kind and degree. Education, in like manner, engraphs a new man on the native stock, and improves what in his nature was vicious and perverse into qualities of virtue and social worth. And it cannot be but that each generation succeeding to the knowledge acquired by all those who preceeded it, adding to it their own acquisitions and discoveries, and handing the mass down for successive and constant accumulation, must advance the knowledge and well-being of mankind, not infinitely, as some have said, but indefinitely, and to a term which no one can fix and forsee. Indeed, we need look back half a century, to times which many now living remember well, and see the wonderful advances in the sciences and arts which have been made within that period. Some of these have rendered the elements themselves subservient to the purposes of man, have harnessed them to the yoke of his labors, and effected the great blessings of moderating his own, of accomplishing what was beyond his feeble force, and extending the comforts of life to a much enlarged circle, to those who had before known its necessaries only. That these are not the vain dreams of sanguine hope, we have before our eyes real and living examples."
Jefferson's Esteem for Classical Literature
Jefferson's esteem for classical literature can be seen in the following passage from a letter to his nephew and ward Peter Carr (Paris, Aug 19, 1785),
"...I advise you to begin a course of antient history, reading everything in the original and not in translations. First read Goldsmith's history of Greece. This will give you a digested view of that field. Then take up antient history in the detail, reading the following books in the following order. Herodotus. Thucydides. Xenophontis hellenica. Xenophontis Anabasis. Quintus Curtius. Justin. This shall form the first stage of your historical reading, and is all I need mention to you now. The next will be of Roman history. From that we will come down to Modern history. In Greek and Latin poetry, you have read or will read at school Virgil, Terence, Horace, Anacreon, Theocritus, Homer. Read also Milton's paradise lost, Ossian, Pope's works, Swift's works in order to form your style in your own language. In morality read Epictetus, Xenophontis memorabilia, Plato's Socratic dialogues, Cicero's philosophies..." -The Portable Thomas Jefferson
"...I advise you to begin a course of antient history, reading everything in the original and not in translations. First read Goldsmith's history of Greece. This will give you a digested view of that field. Then take up antient history in the detail, reading the following books in the following order. Herodotus. Thucydides. Xenophontis hellenica. Xenophontis Anabasis. Quintus Curtius. Justin. This shall form the first stage of your historical reading, and is all I need mention to you now. The next will be of Roman history. From that we will come down to Modern history. In Greek and Latin poetry, you have read or will read at school Virgil, Terence, Horace, Anacreon, Theocritus, Homer. Read also Milton's paradise lost, Ossian, Pope's works, Swift's works in order to form your style in your own language. In morality read Epictetus, Xenophontis memorabilia, Plato's Socratic dialogues, Cicero's philosophies..." -The Portable Thomas Jefferson
Tuesday, November 16, 2010
Adams, Jefferson and Coke
In his response to the letter of General Brattle in the Boston Gazette in 1773 on the Independence of the Judiciary, John Adams cites Lord Coke who wrote The Institutes of the Laws of England which became a standard text on common law in both England and America. Coke was removed as Chief Justice for his refusal to submit to the king's command. He was later influential as an opponent to the king championing the rule of law and playing a pivotal role in the writing of the Petition of Right.
Thomas Jefferson also appears to have been familiar with Coke. In a letter to John Page dated December 25, 1762, he writes,
"However, whatever misfortunes may attend the picture or lover, my hearty prayers shall be, that all the health and happiness which Heaven can send may be the protion of the original, and that so much goodness may ever meet with what may be the most agreeable in this world, as I am sure it must be in the next. And now, although the picture be defaced, there is so lively an image of her imprinted in my mind, that I shall think of her too often, I fear, for my peace of mind; and too often, I am sure, to get through old Coke this winter; for God knows I have not seen him since I packed him up in my trunk in Williamsburg. Well, Page, I do wish the Devil had old Coke, for I am sure I never was so tired of an old dull scoundrel in my life...But the old fellows say we must read to gain knowledge, and gain knowledge to make us happy and admired. Mere jargon!"
Thursday, October 21, 2010
Independence of the Judicary Timeline
1787 US Constitution: during good behavior
1776 US Declaration of Independence: grievences
1773 John Adams, Works vol 3, p 522: during good behavior & quamdiu se bene gesserint*
1701 Act of Settlement: quamdiu se bene gesserint, patent for judges
1641 House of Lords petition: quamdiu se bene gesserint
1600 General Assembly of the Kirk of Scotland: ad vitam or ad culpam**
1465 De Officiis first printed
44BC Cicero writes De Officiis. Book II, i, contains quam diu and a form of gerere (to conduct)
* so long as they shall conduct themselves well. Note that gesserint is future perfect indicative. The future perfect is used in Latin conditional clauses.
** for life or until fault (see end of 1st session)
Some Selections from Cicero's De Officiis (On Duties)
Beneficence and liberality:
Let me now, as I propossed, speak of beneficence and liberality, virtues that are the most agreeable to the nature of man, but which involve many precautionary considerations. For, in the first place, we are to take care lest our kindness should hurt both those whom it is meant to assist, and others. In the next place, it ought not to exceed our abilities; and it ought to be rendered to each in proportion to his worth. This is the fundamental standard of justice to which all these things should be referred. For they who do kindnesses which prove of disservice to the person they pretend to oblige, should not be esteemed beneficent nor generous, but injurious sycophants. And they who injure one party in order to be liberal to another, are guilty of the same dishonesty as if they should appropriate to themselves what belongs to another. (Offices I, xiv, p. 25)
Administration of government:
All who hope to rise in a state ought strictly to observe two rules of Plato. The first is, that they so keep in view the advantage of their fellow-citizens as to have reference to it in whatever they do, regardless of their individual interest. The second is, that their cares be applied to the whole of the state, lest while they are cherishing one part they abandon the others. For the adminsitration of government, like a guardianship, ought to be directed to the good of those who confer, and not of those who receive the trust. Now, they who consult the interests of one part of a community and neglect another, introduce into the state the greatest of all evils, sedition and discord. (Offices, I, xxv, p.44)
Magistrates:
Neither is it foreign to my purpose to touch upon the duties of magistrates, of private citizens, and of strangers. It is then the peculiar duty of a magistrate to bear in mind that he represents the state, and that he ought, therefore, to maintain its dignity and glory, to preserve its constitution, to act by its laws, and to remember that these things are committed to his fidelity. (Offices, I, xxxiv, p. 61)
Knowledge and protecting rights:
...For the knowledge and contemplation of nature is in a manner lame and unfinished, if it is followed by no activity; now activity is most perspicuous when it is exerted in protecting the rights of mankind.
It therefore has reference to the social interests of the human race, and is for that reason preferable to knowledge; and this every virtuous man maintains and exhibits in practice. For who is so eager in pursuing and examining the nature of things, that if, while he is handling and contemplating the noblest objects of knowledge, the peril and crisis of his country is made known to him, and that it is in his power to assist and relieve her, whould not intantly abandon and fling from him all those studies, even though he would be enabled to number the stars, or measure the dimensions of the world? And he would to the same were the safety of a friend or a parent concerned or endangered. From this consideration I infer, that the duties of justice are preferable to the studies and duties of knowledge, relating as they do to the interests of the human race, to which no anterior consideration ought to exist in the mind of man. (Offices I, xliii, p. 72)
Discourse versus thought:
Nor do those philosophers only instruct and educate those who are desirous of learning while alive and present among us; but they continue to do the same after death, by the monuments of their learning; for they neglect no point that relates to the constitution, the manners and the morals of their country; so that it appears as if they had dedicated all thir leisure to our advantage. Thus while they are themselves devoted to the studies of learning and wisdom, they make their understanding and their skill chiefly available to the service of mankind. It is therefore more serviceable to the public for a man to discourse copiously, provided it is to the purpose, than for a man to think ever so accurately without the power of expression; the reason is, because thought terminates in itself alone, but discourse affects those with whom we are connected in a community.
...Every duty therefore that operates of the good of human community and society, is preferable to that duty which is limited to speculation and knowledge. (Offices I, xliv, pp. 75-6)
Sunday, October 17, 2010
Plato and Cicero
Plato's Sophist is interesting because it illustrates the dialectical analyisis and the use of opposites. It's one of the better dialogues that I have read and I am a little disappointed that it was not in the book of Plato's dialogues that I have. As to the Stranger being a god, that is probably hyperbole although I suspect that Zeno played Son of Hermes when he and Parmenides visited Athens and met with Socrates. The Sophist probably draws from the philosophy of the Pythagoreans rather than that of that of the Athenians.
Cicero's De Officiis which discusses ones moral duty in serving society is good reading. Cicero had an inclination for philosophy and studied in Athens. The book is addressed to his son. Marcus Aurelius and others have done similar works. De Officiis was the second book to appear in print. It later served as a primary introduction to Latin. James Madison, who studied at Princeton, probably read him as part of his course of study. Thomas Jefferson had several works by Cicero in his library which were later donated to the Congressional Library. Much of what Cicero says is still relavent today.
Both Plato and Cicero wrote works discussing the republic. Much of Cicero's De Re Publica was concealed as a palimpsest until 1822 so it was not available at the time of the US Constitutional Convention.
Wednesday, September 22, 2010
Impressions vs Forms
We have seen that we can find fits that are very close to the actual characteristics for diodes. But fits bear the same relation to characteristics as an image does to an object. Our observations are not perfect and there are distortions present. The same relation exists between a print and the typeset page from which it was made. It is impression versus form.
The ancient Greek philosophers assigned a greater reality to the forms than our perceptions of them. The problem is similar to that of doing fits with the patterns being somewhat imperfect. But the same pattern may be applicable to a number of similar objects (in our case diodes) with different coefficients in the characteristic equations.
In The Sophist Plato uses an "Eleatic Stranger" with extraordinary skill to try to capture what we mean by a sophist. The Stranger first uses the dialect method in an attempt to pin down the sophist but he proves to be an elusive quarry. He appears to be many things at once. After studying "being" and "not-being" and what we mean by these terms he comes to the conclusion that the sophist is a pretender. He does not possess or impart true knowledge. The dialectic is a process of defining a pair of cases to which the object in question either belongs or does not in order to specify what it is. The Stranger looks down on the Sophist and is cutting him at the same time. The Sophist does not rank with the Philosopher.
The case is not quite so bad with the fits but one still can't trust them completely. Theory might help narrow down equations to be fitted but measurements usually have errors associated with them and can produce unavoidable residuals as a result.
Saturday, September 18, 2010
5.1 V Zener Diode Conductance and Estimated Error in Voltages
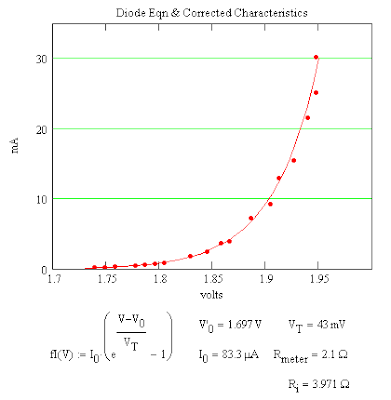
We can refer to the ratio of small changes in current for small changes in voltage as a conductance*. It is the slope of the a line tangent to the V-I characteristics and in calculus is referred to as a derivative. The unit for conductance is the Siemens, S. If one plots this function for the 5.1 V Zener diode one sees that the conductance starts to increase rapidly at about 4.75 volts.

This conductance can be used to estimate the errors in the voltage measurements and compute corrections. The formula is ΔV = ΔI/G. The results for the steep part of the V-I characterists is shown below. This shows that even though the residuals are relatively large the corrections to the voltage needed to place the points on the curve are within about 1/2 the precision of the measurements and appear to be just round off errors.

The residuals for these points were more randomly distributed. The "corrections" for lower voltages were larger where the curve was flatter and where the fit appeared to deviate somewhat from the data. The conclusion is that relatively larger residuals are to be expected where the slope of the curve is relatively steep.
*edit: This is not the usual conductance which is defined in terms of Ohm's Law, G = I/V. My terminology is somewhat lax. A more appropriate expression might be "small signal conductance" or "differential conductance."
Thursday, September 16, 2010
Does Least Squares Make the Best Choice for Coefficients?
Least Squares is often used to find a fit to a set of data. Linear Least Squares is easier since the solution for the unknown coefficients only involves a set of equations which are linear functions of the unknowns. The primary condition for a least squares fit is that the sum of the squares of the residuals be a minimum. The result is that portions of the fitted curve can have a definite deviation from the data set and still result in a minimum value for the sum.
For the fits of the data for the Zener diode I used Mathcad's genfit function. For the composite functions of the last fit the individual fits can also be done by fitting lines in a log-log plot*. One of the problems that I encountered in doing the fits is that the fitted function tended to cut corners in the region of the "knee" where the characteristics change from lower currents to higher ones. As a result there is a correlation among neighboring residuals there. Intuitively one would expect that the residuals would be randomly distributed with respect to the fitted curve for the best fit. There seemed to be something wrong with the residuals.
I decided to give the rms residual more control in doing the fit. I tried dividing the data into sections with each section being represented by a term in the fit function. The result is that the residuals differed for each region. This method also seemed somewhat arbitrary since the terms for the function depended on how the data was partitioned. The results suggested the use of a Taylor series for the current involving exponential functions. Fitting a quadratic function of the first fit didn't work. The difference between the fit for lower currents and the data looked closer to an exponential function that was fairly linear for lower currents so I tried multiplying the current by a factor involving an exponential term. That worked much better than the Taylor series. Varying the number of data points included in the first fit optimized the final fit. The rms residual was closer to the result of a tedious process involving a search for the coefficients in a region of fixed size and a random choice from among a few of the lowest values of the sum of the squares of the residuals to avoid getting "stuck in a loop." (The results of the second fit method weren't consistent. The coefficients posted were the best values found.)
The results show the utility of the residuals in analyzing the results of a fit and comparing one fit method with another.
The economists like to use linear models for optimization problems but nonlinear models may prove to be more useful. Fits can be used to find approximate functions for observable relations in a theory. Doing what is best for the individual is not necessisarily at odds with doing what is best for the group. The problem may be similar to that of finding the best fit for a set of data.
*edit: One would have to do a semi-log plot. For the first fit involving the lower curve one would also have to ignore the small constant, u_0, and plot log(I1/mA) vs V. For the second plot it would be log(I2/I1 - 1) vs I1 (I2>I1) with I1 being the current in the first fit and I2 that of the second fit.
Impossible Choices
Arrow's Social Choice and Individual Values and Sen's Liberal Paradox point out some of the failings of the democratic process and the impossibility of reaching a group concensus on a number of options. But this just validates the need for a mechanism to make a decision in the absence of a majority or the situation where the outcome is unclear. In the case of a tie in the US Senate the Vice President gets the deciding vote. Congress is empowered to decide the outcome of the elections of its members. In these situations the decision that is made is not democratic since the voters failed to reach a decision.
If the choice is left solely to individuals though some people can end up benefiting at the expense of others. The most powerful factions end up being self-serving and disregard the interests of others.
Arrow also points out that capital is not the only way to improve productivity. Technological innovation can substitute for capital. This includes the arrangement of the workplace. Improved economy has its benefits. There are other ways of improving. One is education which improves the value of workers. And an economic slowdown may indicate that there are forces at work which tend to obstruct progress.
Monday, September 13, 2010
The Problems With Fitting Zener Diode Characteristics
Part of the difficulty in fitting the V-I characteristics of a Zener diode seems to be due to the current being a exponential function of an exponential function resulting in a very rapid change in the conductance of the diode. If one fits the characteristics for smaller currents one gets an exponential function for the current. The steep portion of the curve appears to be an exponential function of the first current. As a result the conductance, G, of the diode—the slope of the curve at a particular point—becomes quite large. At any point the change in current ΔI = G ΔV, the conductance times the change in voltage so a small error in measuring the voltage will result in a large shift in the current measurement.

The fit above consisted of two fits, the first for current of the lower part of the curve and a second fit to determing the diode current as a function of the first current. Both curves are easy to fit. The rms residual is still large compared to the precision of the measurements which was 0.01 mA for the current and the 0.01 volts for the voltage. In the plot of the residuals below one sees large deviations at the higher currents. The relative deviations (residual/current) are of the same magnitude for all currents

The current being a function of a current is consistent with a controlled breakdown. There is also a certain amount of noise present and the current fluctuates some due to a statistical component. The largest contribution to the rms deviation is from the upper portion of the curve.
Supplemental: The correlation among neighbouring residuals near I = 0 mA indicates that the fitted functions are not quite right but this error is small compared to larger residuals which may have contributed to errors in the values of u and v.
Saturday, September 11, 2010
A Better Fit for the 5.1 V Zener Diode
By using the diode equation and tinkering with the fit procedure I was able to get a better fit for the 5.1 V Zener diode.


I made another set of measurements and they are in good agreement with the first set. There still seems to be some residual error greater than the precision of the measurements. Most of the error is above 4.0 volts. So I should probably checked for internal resistance.
Tuesday, September 7, 2010
RadioShack 5.1 V Zener Diode V-I Characteristics
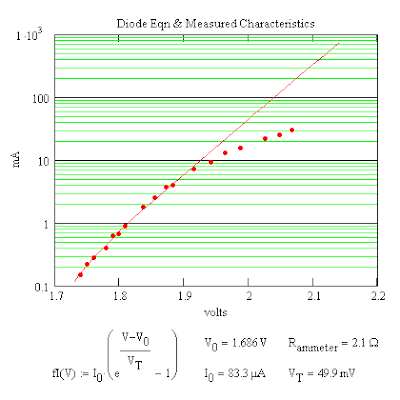
Over the weekend I've been studying the characteristics of a RadioShack 5.1 V Zener Diode. The Zener diode is used as a voltage reference since its relative change in voltage is small compare to a relative change in current above the indicated voltage. I was able to get a good fit to the measured characteristics**.


The form of the equation that I used to fit the characteristics curve just involved variables in the exponents. It is by no way unique as can by the fact that a multiplying current can be canceled out by a constant in an exponent. The fit proved challenging since my computer kept encountering singularities and it was difficult to find a starting point for a solution.
I was able to get a fairly good fit by fitting the upper and lower branches of the curve separately. The lower part is just the regular current for a reversed diode and an exponential curve is a good approximation. The upper branch includes in addition the breakdown current for the diode so one can fit the difference between the measured values and the extrapolated fit for the lower part of the curve. I also tried a linear estimate of the zero* of the variance but that proved rather slow. A quadratic estimate of the zero of the variance proved to be quicker after one got away from β = 0 where there was a singularity.
The fit shown started with a linear estimate of the zero and then switched to a quadratic estimate for faster convergence. It confirms the presence of two currents.
*edit: It was the zero of the least squares fit for which the variance is a minimum.
**edit: I corrected for the voltage drop across the milliammeter and got a steeper slope above 5.1 V and the rms deviation, δ'_rms, reduced to 0.320 mA which probably means that there is better agreement with the assumption of two currents. The diode may also have some internal resistance.
Thursday, September 2, 2010
NIO Sets His Sights the Moon
NIO did a little more stargazing this morning and managed to capture an image of the Moon.


I found that there were more manual exposure options available but it was difficult to get the focus right with the optical zoom since the image wasn't in focus with the focus set at ∞. I'm going to have to work on that. Using as wide an aperature as possible would probaby help some but without a telescope I doubt if it will be possible to capture much of the fine detail.
Tuesday, August 31, 2010
NIO's Observer Function
I wanted to check how NIO translates exposures into B&W pixel values and I found that I needed to set the current through the RS green LED equal to 3.16 mA to cover a significant portion of the exposure curve. The slide viewer diffuser was placed between the LED and the camera to spread out the light as evenly as possible. The ISO was set to 100 and the f-Number, fN, was initially set at 2.8 while the exposure time was varied from 1/8 sec. to 1/2000 sec. I still needed more data so I left the exposure time at 1/2000 sec. and increased fN in increments from 2.8 to 8.0. The peak values for each image was then determined. The smooth curve is a fit which matches the data while keeping peak value at 255 and dropping to zero for large EV values.
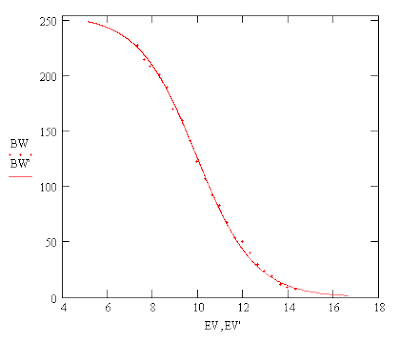

The observed curve doesn't appear to be the power law with a gamma of 2.2 as was assumed earlier. We can refer to the exposure curve as NIO's observer function. It's part of a personal equation.
Sunday, August 29, 2010
NIO Does a Little Stargazing.
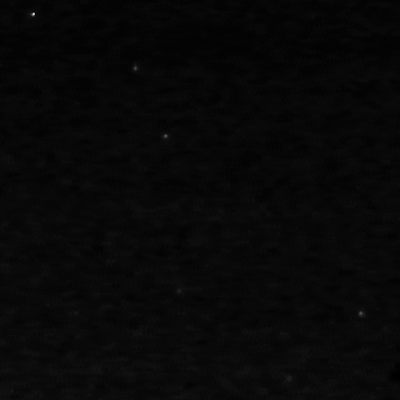
NIO managed to get in a little stargazing this evening. The Big Dipper was towards the North-West and NIO was able to capture an image with the maximum aperature available. The three stars in the upper left form the handle and Dipper itself is to the lower right. The two bottom stars are just barely visible but the star where the handle and dipper join is too faint to be seen at all.
click to enlarge
The stars were brightened relative to the background using a power law with the power, p, equal to 1.6. You may have to click to enlarge the photo to its original size.

The stars were brightened relative to the background using a power law with the power, p, equal to 1.6. You may have to click to enlarge the photo to its original size.
The Effect of a Diffuser in Front of the LED
A diffuser can help spread out the light more evenly across the projected beam of light emitted by the LED. To demonstrate this I place the diffuser of an old slide viewer next to the LED.
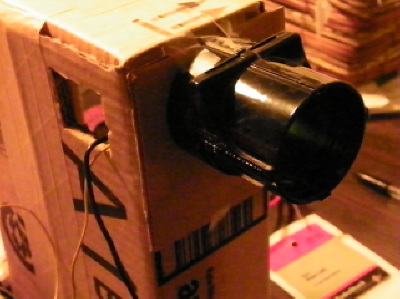
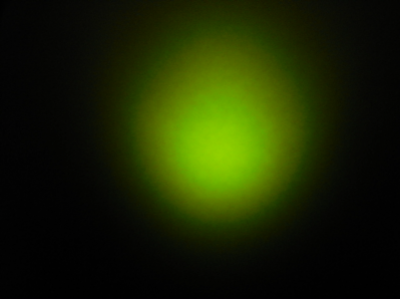

I then placed the frosted glass plate in front of the slide viewer diffuser and took a picture to show its angular distribution.

A spotmeter indicated that the center of the distribution was EV = 8.1 which corresponds to a luminance of 38.2 cd/sq meter.
So the diffuser spreads out light more evenly and can compensate to some extent for the flaws of the light source. It may also widen the viewing angle of the LED.
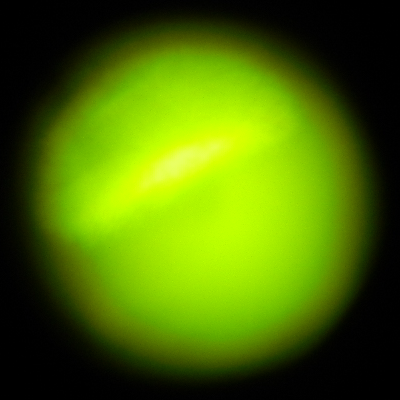
The LED's Luminous Emittance
The LED's emissions are not the same in all directions. To capture this I placed a frosted glass plate in front of the LED at various distances from it and took a picture of the illuminated plate. As the pattern gets larger farther away from the LED one can make out the shape of the luminous square inside the LED.
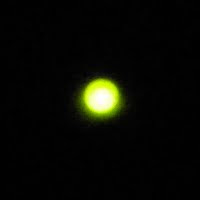
3 cm
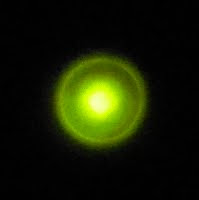
9 cm
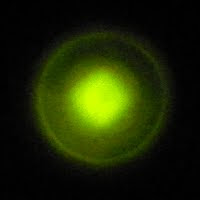
15 cm
There seems to be a "halo" which surrounds the brighter center of the pattern and grows linearly with distance.
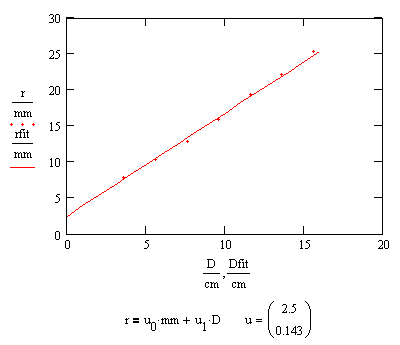
The edge of the halo marks a cone which bounds the emitted light. The angle between the lines common to a plane cutting the light cone in half and the light cone is 18°. At larger distances the central pad where the whisker makes contact interferes with a uniform distribution of light.
Saturday, August 28, 2010
A Standard Candle?
The power law for the luminous intensity indicates that a current of 25.5 mA through the LED will produce an intensity of 0.50 cd. So two of them with the same current flowing through them should produce an intensity of 1.0 cd if both LED have the same characteristics. An LED with a square of luminous material whose side 1.25 that of the one in the measured LED would be capable of producing 1 cd at the same level of emittance. If the internal resistance is the limiting factor on the maximum current then reducing it will allow more light to be produced by the LED before failure and its V-I characteristic would be closer to that of an ideal diode.
Friday, August 27, 2010
Summary of the Characteristics for the RadioShack 5mm Green LED
Here is a summary of the characteristics for the RadioShack 5mm Green LED:
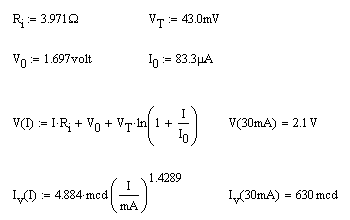

I_v is the luminous intensity in millicandelas as a function of current. I couldn't verify the 630 mcd value at 30 mA so it should be considered "nominal".
The measurements suggest the possibility that LEDs might be used as a convenient reference light source for photographic purposes and other uses. The internal design could be modified to provide a square source of known size and therefore known luminance. Perhaps the contact pad moved to one side and the perimeter of the luminous material covered to produce a convenient photographic source. A flat plastic covering would probably alter the apparent size of the source slightly. Accurate measurements of the characteristics could be supplied with the reference LED for the convenience of the user.
A Peek Inside the LED
After turning down the intensity of the light from the LED was able to get a peek inside and could see where the light was coming from. There is a square piece of luminous material with a dark patch in the center. The dark patch appears to be the contact point for a thin wire (whisker) coming down from the top left.
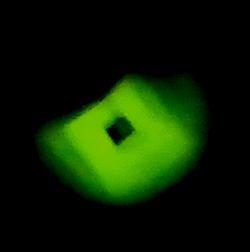

I had a bit of trouble with the focus on this image. I adjusted the image to give the best view of the square. I could see it more clearly by eyeball but I am myopic so I can focus closer than the average individual and get a little extra magnification in addition.
Thursday, August 26, 2010
Relative Luminance vs Current
To measure the light emitted by the green LED I took a series of three pictures for each value of current using an EV bracketing of plus or minus 0.3 EV and adjusted the exposure so that the spot meter indicated that the exposure of the LED was at about +1.0 EV. The image was reduced to B&W and the pixel values were decompressed. The total "luminance", L, for each image was determined by summing the values for each pixel and the three bracketed luminances for each current setting were interpolated to find an EV correction which set log L equal to a central value of 6.8.

The plot of the relative flux vs the current in mA proved to be linear on a log-log plot and the slope and intercept were computed.


The EV for each current was computed from the exposure settings of the central image and the adjustments were made to get the EV which "equalized" the exposure. One can manipulate the formula for the EV to show that the relative flux, φ, is equal to 2 raised to the power of the EV.

The plot of the relative flux vs the current in mA proved to be linear on a log-log plot and the slope and intercept were computed.

So we have found the relative amount of light emitted by the LED as a function of the current in mA. Conversely, for a given relative flux we can compute the current required and use a milliammeter to control the LED light output.
Wednesday, August 25, 2010
The Green LED's Spectrum
A test exposure of the green LED's spectrum with the Kodak Z981 produced this image.


I used a white index card to illuminate the scale with a Sylvania Daylight plus CFL and produce a faint fluorescent spectrum just under the scale for reference. The lines visible are at 546.5 nm and 611.6 nm. The LED has a continuous spectrum over a limited range.
New Observer Onboard
I'd like to introduce everyone to my new lab assistant. This is NIO short for Naive Impressionist Observer. NIO will be doing most of the observing from now on and will be handling a lot of the record keeping tasks.
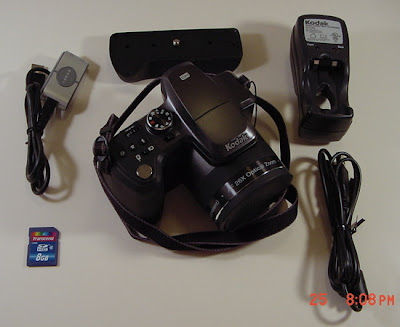


NIO could not transfer images directly to my computer either through the cable link or the SDHC flash memory so I had to purchase a Dynex card reader to act as translator. NIO is a Kodak digital camera designed in Japan and made in Vietnam. It appears to be an updated version of the Sony Cybershot with better aperature control.

The Kodak Easyshare Z981 is a PASM Auto Exposure camera with program mode, aperature priority, shutter priority and a manual mode. The manual mode allows one to control the exposure by independently setting the f-stop, shutter speed and ISO speed. In the image above one can see the spot meter reading (bottom row center) which helps in the selection of the exposure settings. I had to consult the online Extended User Guide in order to find out how to change the settings. There is also an optical zoom for distance shots.
Tuesday, August 24, 2010
Equivalent Circuit for an LED
The deviation of the measured characteristic from an ideal diode at higher currents can be explained by an internal resistance within the diode. If one allows for an internal resistance one gets an almost perfect fit with the ideal diode equation for all values of the measured current. So the diode equation does appear to work.
The results suggest the following equivalent circuit for a real diode. There appears to be an interval voltage source, V0, an ideal diode characterized by I0 and the thermal voltage and an internal resistance.


The results suggest the following equivalent circuit for a real diode. There appears to be an interval voltage source, V0, an ideal diode characterized by I0 and the thermal voltage and an internal resistance.

I do not know enough about the internal structure of the diode to explain the internal voltage barrier. It may to due to a Fermi energy which is associated with the chemical potential, μ, a measure of the free energy of the charge carriers in the diode.
Monday, August 23, 2010
Comparison of the LED Characteristics With the Diode Eqn
The diode equation did not give a good fit to the LED characteristics. The fit that I got for the smaller values of current indicated that a voltage, V0, needed to be subtracted from the measured voltage. The intermediate values fit better if a correction to the measured voltage, V, for the IR voltage drop across the milliammeter was made. The maximum IR voltage drop was 0.06 volts. The larger currents still tended to deviate from the modified diode equation.
I do not know why V0 is needed. It could be that light produces a contact electrification of the junction in the LED.

I do not know why V0 is needed. It could be that light produces a contact electrification of the junction in the LED.
Sunday, August 22, 2010
Measuring the Characteristic Curve for an LED
Last month I was forced to break hard to avoid hitting a doe on the road at 3 am one morning near Oakhurst, CA and the developed a "shimmy" or jerking motion in the steering afterwards. I took the car in to have the front end realigned and put new tires on and now its back to normal.
While waiting for the repairs to be done I picked up some LEDs at RadioShack. There wasn't much information on the LEDs except forward voltage 2.1 V, current 30 mA, luminous intensity 630 mcd, and wavelength 565 nm. So I tried to measure the characteristic curve using two 1.5 V AA batteries, a resistance box and a digital multimeter to measure the current but the curves proved to be useless even though I corrected for the voltage drop across the resistance box. I decided to get a second digital multimeter and this time measured both the voltage across and current through the LED. The results were better.


The function for the characteristic curve is empirical and gives the current in milliamps. The -1 is needed so that the current will be 0 mA when the voltage is 0 V. A cubic exponent gives a good fit over the range of the voltages measured.
Limits of Detectability
One can use analytical instruments to make rough measurements of the chemicals in a sample of water but adjustments need to be made to these measurements to compensate for complicating factors. Fluorescence spectroscopy is capable of measuring quantities in a substance with concentrations down to the level of parts per billion. Samples cells are compared with standard cells of known concentration. When one is working near the limits of detection (LOD) the accuracy of the results may suffer. When a substance is present below the LOD false negatives are likely. With a bulk sample there is also the possibility of interactions between the molecules present which will alter results somewhat.
One encounters similar problems with human perception. For the eye the limit is the dark adaption threshold. At low light levels an image becomes pointilistic and scintillating. The eye is not equally sensitive to all colors of the same intensity and this is the subject of colorimetry.
One encounters similar problems with human perception. For the eye the limit is the dark adaption threshold. At low light levels an image becomes pointilistic and scintillating. The eye is not equally sensitive to all colors of the same intensity and this is the subject of colorimetry.
Friday, August 20, 2010
Recommended Reading
For more information about Quantum Optics and Fluorescence Spectroscopy the following references may provide some background material.
Petroleum in the Marine Environment: UV Fluroescence Spectrometry
Laser Experiments for Beginners by Richard N. Zare
Petroleum in the Marine Environment: UV Fluroescence Spectrometry
Laser Experiments for Beginners by Richard N. Zare
What Would a Critical Analysis of the Oil Spill Require?
The goal of the government with respect to the determination of the extent of the spill would be to arrive at an unbiased estimator of the amount of oil released into the environment. BP is probably entitled to due process when making this estimate. A critical analysis of the raw data would try to remove any systematic error in the process and try to be as exact as possible. An initial analysis may not have to be so critical to provide guidance to the responders. But the lack of a baseline study certainly would complicate the arrival at a final conclusion. Perhaps they should be required in the future.
Rep. Markey asked for a formula used in the oil budget calculator. Fluorescence spectroscopy which was used to measure the concentration of the oil near the well falls under the domain of Quantum Electrodynamics. To determine the transition rates one needs to know the oscillator strength function which is related to the Einstein coefficients. One might be able to adjust the spectroscopy data by subtracting the distribution for Rayleigh scattering to arrive at a better estimate. A study of Raman scattering might confirm results. The analysis requires expert knowledge.
Rep. Markey asked for a formula used in the oil budget calculator. Fluorescence spectroscopy which was used to measure the concentration of the oil near the well falls under the domain of Quantum Electrodynamics. To determine the transition rates one needs to know the oscillator strength function which is related to the Einstein coefficients. One might be able to adjust the spectroscopy data by subtracting the distribution for Rayleigh scattering to arrive at a better estimate. A study of Raman scattering might confirm results. The analysis requires expert knowledge.
Thursday, August 19, 2010
The Scattering of Light by Small Particles
Light is scattered by small particles and the effect is dependent on the wavelength of the light used. If the size of the particles is much smaller than the wavelength of the light then Rayleigh scattering applies, otherwise, Mie theory is used. Light absorption can also be used to measure the concentration of a solute in a solution. The formula used is known as the Beers-Lambert Law. Data collected by these means can be used to determine the concentration of the oil particles dispersed in the water column of the Gulf in the area of the oil spill. The availability of more than one method allows cross checks to be made on the results. The method used in the reports mentioned previously to measure the presence of oil in the water column appears to be spectrofluorometry. The results of this method can be complicated by Raman scattering in which changes in the frequencies of the light emitted occur and Rayleigh scattering. Rayleigh scattering is just elastic scattering of a photon of light off a molecule and doesn't involve fluorescence in which the molecule absorbs the energy of the photon and then re-emits it. If one is not careful one can get false positives for the presence of a particular molecule. One needs to compare results with an uncontaminated sample or observe changes over time.
An interesting effect is that of critical opalescence which can be seen in this YouTube video.
An interesting effect is that of critical opalescence which can be seen in this YouTube video.
Gulf Oil Spill & Seafood Safety Committee Hearing
Rep. Markey today conducted a hearing into the safety of seafood from the Gulf as a consequence of the BP oil spill. This hearing is currently available online at C-SPAN.
The seafood sampled were deemed to be safe for human consumption. The main concern was the presence of polycyclic aromatic hydrocarbons (PAHs). The Oil Budget referred to during the hearings indicates what happened to the spilled oil (summary). A more technical report discusses the Oil Budget Calculator about which Rep. Markey asked for more detail on the formulas used. These reports on which the discussion is based are part of a ongoing process conducted by a collaboration, the Joint Analysis Group and the conclusions are not yet final.
The seafood sampled were deemed to be safe for human consumption. The main concern was the presence of polycyclic aromatic hydrocarbons (PAHs). The Oil Budget referred to during the hearings indicates what happened to the spilled oil (summary). A more technical report discusses the Oil Budget Calculator about which Rep. Markey asked for more detail on the formulas used. These reports on which the discussion is based are part of a ongoing process conducted by a collaboration, the Joint Analysis Group and the conclusions are not yet final.
Saturday, August 14, 2010
Can We improve on the Digital Color Camera?
During the early days of color television when people still had B&W televisions both signals had to be transmitted so a quadrature modulation system was used to send monochrome, M, and two differences I and M. The monochrome channel was the luminance Y and a transformation from RGB to Y was done using the following equation but the assumption was the use of illuminant C which is north sky daylight.

(The quadrature system is also used for stereo.) So the luminance is definitely dependent on the wavelengths of the light illuminating a scene.
One wonders if it is possible to improve on the color camera. Digital color cameras use either the 3CDD method or Bayer filters to capture the RGB information. But there are other color spaces such as CMYK. A variant on CMYK might be RGBY in which an unfiltered image is used instead of a second G image. A camera using RGBY would be able to take B&W pictures. One of the reasons for using M/I/Q in color television was the reduction in bandwidth needed to store an image. Something similar might improve image compression for storage. An opponent color space is also a possibility.
I still have some doubts about the heights of the peaks on the camera spectrometer. I assumed an equal energy white for the illuminant which has equal amounts of R, G and B and so each coefficient of the Y conversion formula is then 1/3. Daylight illumination is close to this. The light from the fluorescent bulb is whiter than normal. So the assumption of an illuminant affects the conversion process. And the old formulas will no longer work if new primaries are being used.
Friday, August 13, 2010
Using Exposures Instead of RGB Values
The exposure of a pixel represents the quantity of light captured by it when a picture is taken and presumably this is gamma compressed to give the RGB values. So before adding these values together they would have to have the gamma corrections applied to them. This would include the values used for averaging over the a number of pixels to smooth the results. In Fink's Television Engineering Handbook (1957), Ch. 4, p. 9, which uses the CIE 1931 color system, it is stated that at each wavelength that a match is made the luminance of a spectral line is equal to the sum of luminances of the RGB components. The implication is that we just have to add the gamma corrected RGB values to get the total illumination. Division by three doesn't affect the relative illumination of a pixel. The result is then closer to the response that one would expect for the eye being greatest for the 546 nm spectral line of mercury (Hg).
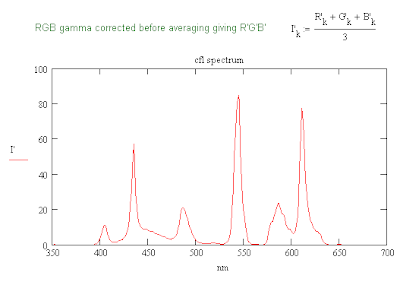 This plot suggests that the color temperature might be higher than data sheet indicated. It is similar to that of the "narrow band" illuminants F10-12 and seems to lie between F12 and F11. The bulb used was not exactly the same as those listed in the datasheet.
 This plot suggests that the color temperature might be higher than data sheet indicated. It is similar to that of the "narrow band" illuminants F10-12 and seems to lie between F12 and F11. The bulb used was not exactly the same as those listed in the datasheet.
Thursday, August 12, 2010
CFL Spectrum with Gamma Correction
The vertical scale of the intensity for the CFL spectrum found in the last blog is nonlinear due to the fact that the camera uses gamma compression to raise the values at the bottom of the scale making the image more sensitive to lower light levels. The images have to be gamma corrected by the display device. The value of gamma that was agreed upon for sRGB is 2.2.

The plot above is for the same CFL spectrum found previously but with a gamma correction applied to the vertical scale. The relative heights of the peaks are probably dependent on the formula for converting the RGB values to a B&W value. The function that my computer uses to convert a color image to B&W shows a stronger response to the G values which one would expect since the eye is most sensitive to 555 nm. I probably need to look for a better conversion formula.
edit: The eye's response to light of different wavelengths is measured by the luminosity function. The RGB values are determined by the color matching functions. All four depend on the illuminant since the spectral power density is a function of wavelength. The conversion formula used may assume a standard illuminant.
Improving on the Accuracy of Your Spectrometer
One can use compact flourescent lightbulbs (CFLs) to check the accuracy of one's spectrometer and make the necessary corrections. The CFL that I used was a Sylvania Daylight Extra mini 100 which is rated at 1600 lumens, 23 watts and has a color temperature of 3500 K and has a mercury spectrum. Instead of a continuous spectrum like that in incandescent bulbs that of mercury consists of discrete lines.

Using the scale of the spectrometer one can find a line which converts the horizontal number of the pixel, x, to a wavelength, λ, measured in nanometers. One can get the intensity of the lines by using the pixel values of a B&W image or convert the RGB values for each pixel using the formula* I = (R + G + B)/3 and then measure the x values of the peaks using the conversion formula to get measured values of the wavelenths, λ_meas. The reference wavelengths were obtained from a Wikipedia plot of the flourescent light's mercury (Hg) spectrum and these were used to obtain a formula for the corrections, Δλ, for the measured wavelengths.
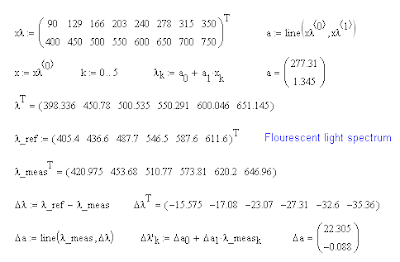
The errors in the positions of the lines ranged from about -15 nm to -35 nm depending on the value of the measured wavelength.
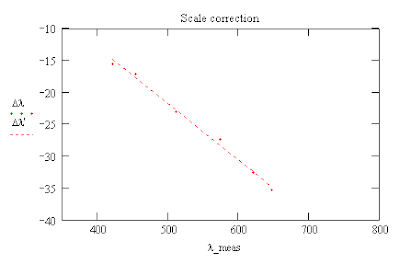
One can then use these formulas to calculate a corrected scale for the wavelengths of the mercury spectrum.

The errors in the positions of the lines ranged from about -15 nm to -35 nm depending on the value of the measured wavelength.

One can then use these formulas to calculate a corrected scale for the wavelengths of the mercury spectrum.

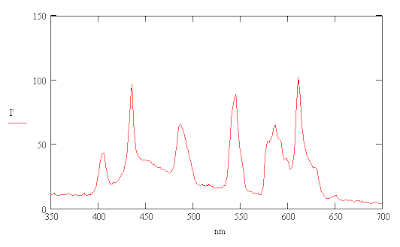
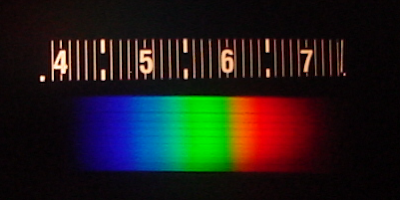
I was also able to compensate for a slight tilt of my camera relative to the spectrum by averaging along a line slightly shifted from vertical which improved the resolution enough to show an indication of the multiple lines just below 600 nm. This result can be compared with the spectrum for a CFL with a 3500 K color temperature in a Sylvania technical factsheet for their compact flourescent bulbs. Narrowing the slit of the spectrometer slightly by taping a thin piece of cardboard from the light bulb carton over it reduces the intensity of the spectrum and also helps to improve resolution slightly.
*This formula seems to be more accurate than the one previously used involving the squares of the RGB values.
Tuesday, August 10, 2010
Adding Violet to the Spectrum
Taking a picture of a spectrum with a digital camera doesn't guarantee that you will capture a complete spectrum. Some colors like yellow and blue do not show up because the power spectrum of the light is fairly uniform over the range of wavelengths present. I narrowed the slit on my spectrometer and took a picture and as you can see the colors yellow and cyan are muted while magenta is missing entirely.
The reason appears to be that the camera is not sensitive enough to red light below a wavelength of 500 nm. Each pixel of an RGB image has values of R, G and B ranging between 0 and 255 for the colors red, green and blue respectively. One can add a synthetic violet to the image by replacing the R value by 4R if the B value is greate than the R value but only to those portions of the image that you want to correct. This effectively makes the R image more sensitive to violet light. The changes are shown below.


In general one probably needs to be more careful about conditions and changes made to the image. The change worked for this example but the same changes would also alter other colors like the white in the scale above the spectrum.
Friday, August 6, 2010
Two Steiner Problem and Soap Film Solution References
I was looking through James Newman's The World of Mathematics, Vol. 2 today and came across the soap film solution to the 5 point Steiner Problem. The original reference is What is Mathematics? by Richard Courant and Herbert Robbins.
Initial Results on the Diffusion Experiment
I have done an initial experiment on the diffusion of food coloring in Knox unflavored Gelatin. I stirred 5 ml of gelatin into 250 ml of warm water in a measuring cup and then heated the solution for 90 seconds in a micorwave oven. After stirring again I poured most of it into 6 90mm Petrie dishes using a straw as a guide and then chilled the mix in the refrigerator for a few hours. My first attempt to let the food coloring gel to diffuse failed because I left it sitting on the light box and it ended up liquifying again. On my second trial I used a tooth pick to poke little globs of coloring gel into the gelatin and returned the dish to the refrigerator. For this experiment I used FD&C blue 1 from a tube of Betty Crocker Classic Gel Food Colors also contains FD&C red 40 and FD&C yellow 5.
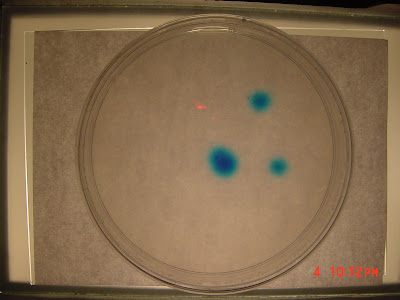
I checked the Petrie dish some time later and the spots of dye showed a noticable amount of diffusion. So I made my first observation which was the image above. I cropped the original 1600 x 1200 image to obtain to get a 150 x 150 image of the lower right spot.

edit: There was a typo in the expression for the expected value of the one dimensional diffusion case. I had initially used λ squared as the divisor in the exponent of the Gaussian function. It's now been fixed. One could call the standard deviation the "deviation length."
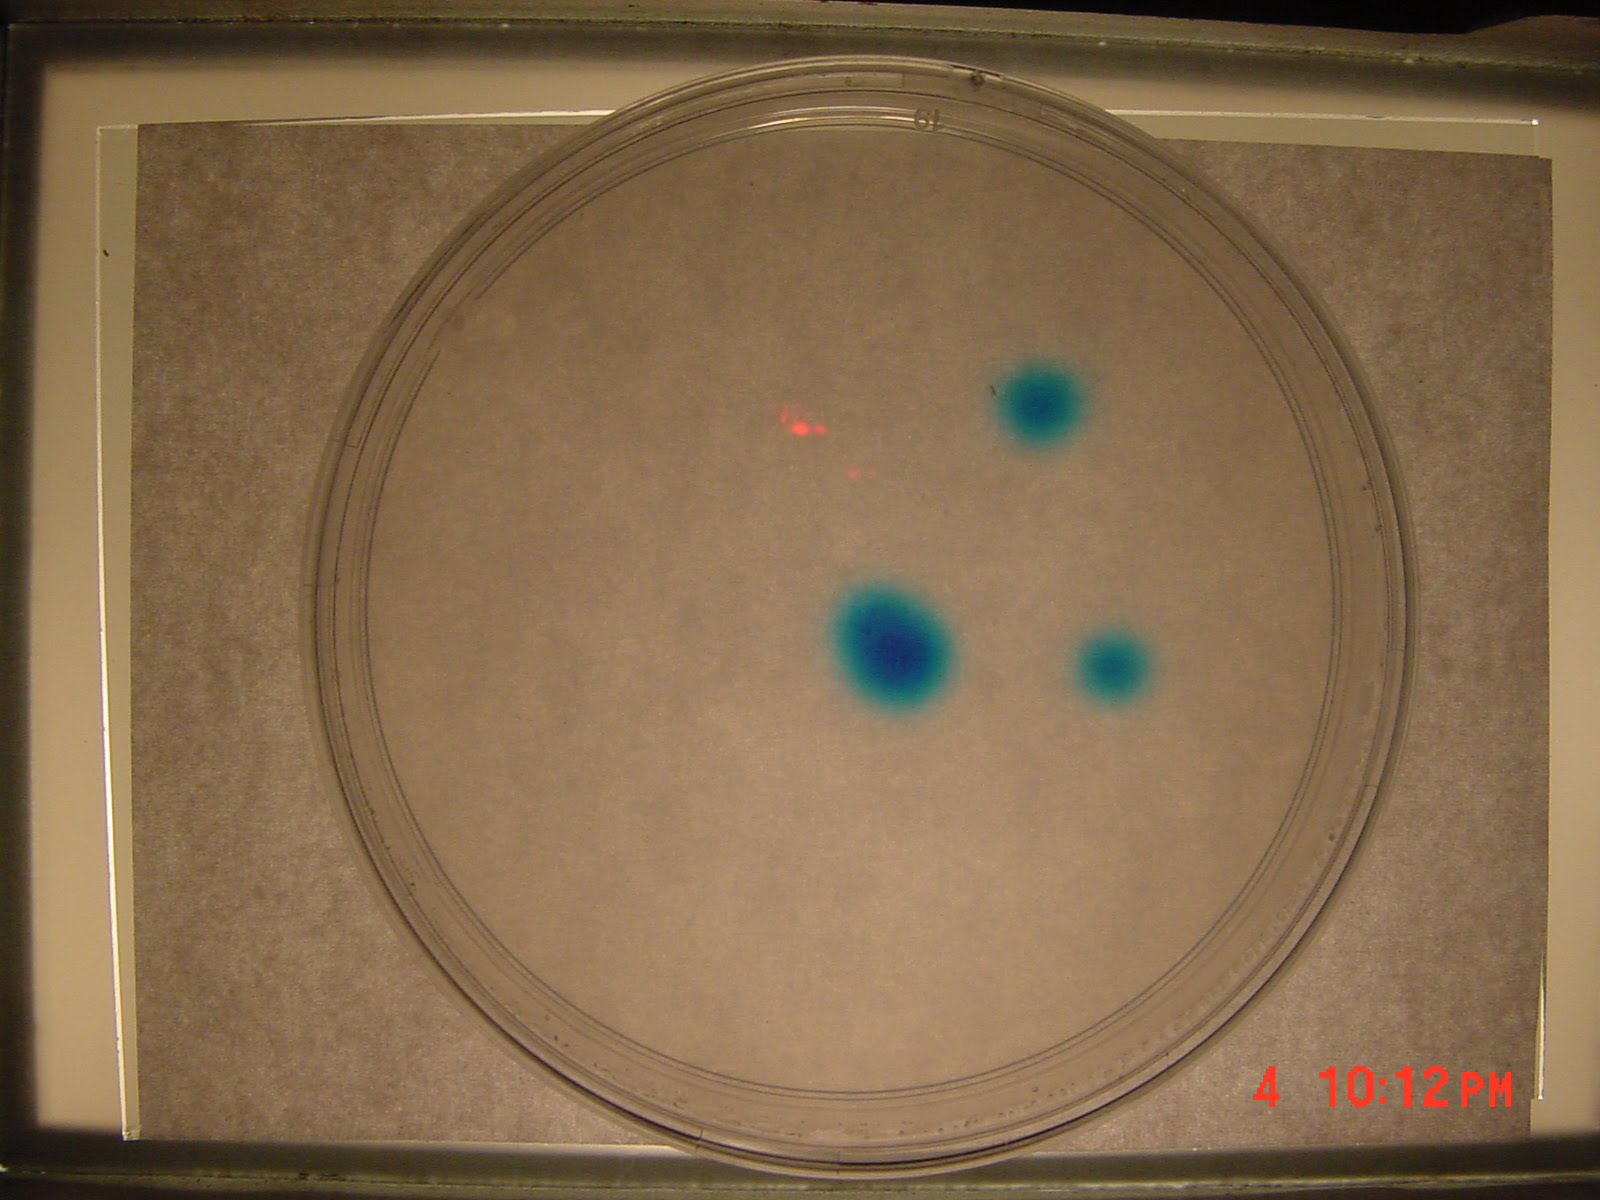
I checked the Petrie dish some time later and the spots of dye showed a noticable amount of diffusion. So I made my first observation which was the image above. I cropped the original 1600 x 1200 image to obtain to get a 150 x 150 image of the lower right spot.

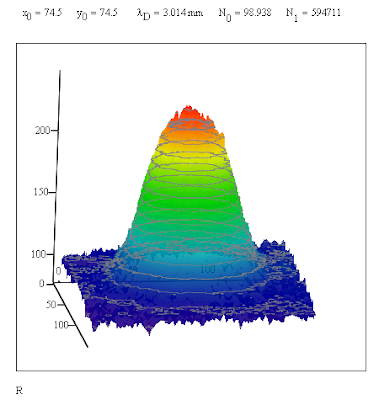
To analyze the results we need some math. For a one dimensional problem the probability distribution function is p(x). This is also known as a Gaussian function. When one calculates the expected value of the square of the deviation from the central value one gets "σ squared" which is the square of the diffusion length. This turns out to be half the devisor in the exponent of e. The numerical factor in front is needed so that the total probability is equal to 1. Again, starting with a Gaussian function for the 2 dimensional case one finds that the expected value of the square of the deviation from the central point. This time it turns out to be just "σ squared" or the square of the diffusion length and so we set this value equal to the disivor in the exponent of e and need a different numerical factor so the total probability equal to 1. One has to add a constant term and multiply the probability distribution by a numerical factor in order to fit the image of the diffused blue dye. The formula below was used.

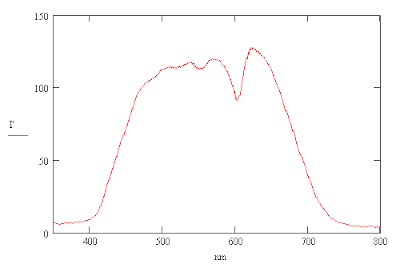
The red portion of the image is the least responsive to blue light so I subtracted the values of the pixels from 255 to get a measure of the absorbtion of the light. The 3D surface plot of the altered R values, R', shows a Gaussian distribution. This distribution was used to obtain a fit to the data. The results are shown above the surface plot.

The x and y values in the image are numbers which give the location of the pixels. To convert the diffusion length into a distance measure on has to use the width of the Petrie dish to obtain a conversion factor. The diameter of the innermost ring of the bottom of the Petrie dish was 83.5 mm which corresponded to 968 pixels. This gave a value for the conversion factor of 86.26 nm/pixel.
edit: There was a typo in the expression for the expected value of the one dimensional diffusion case. I had initially used λ squared as the divisor in the exponent of the Gaussian function. It's now been fixed. One could call the standard deviation the "deviation length."
Wednesday, August 4, 2010
Sony DSC S50 Response for Normal Exposure
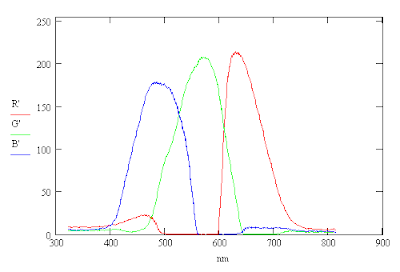
The image of the spectrum for incandescent light looks closer to normal if no exposure bias is used. The camera's RGB color model was designed to work this way. The colors missing from the spectrum are on the left and right ends. The eye see a faint violet at about 400 nm and a richer red about 750 nm. To me there appears to be less yellow and cyan in the true spectrum. The CIE 1931 Color Space which models a standard observer shows more of a "red response" to blue light which seems to be missing from the camera's response.

Note that the RGB response curves are clipped near the peaks giving a flatter response.

The result is that the intensity has two peaks in it corresponding to yellow and cyan which are brighter by nature. The colors red, green and blue are the corners of the color cube which are closer to black while yellow, cyan and magenta are corners closer to white and hence brighter. Physically the energy density at each wavelength in incandescent light is about the same for thermal radiation at 3000 °K and one would expect a similar response at all frequencies. The eye is most sensitive to green and one would expect a stronger response there.
The conclusion is that the camera does not respond in the same way to light that is underexposed as it does to a normal exposure. The colors in shadows may be shifted somewhat. One does not see the colors yellow or cyan in the underexposed spectrum. The underexposed images give a better indication on how the RGB filters work.
edit: Photopsins are the protein-pigment complexes which determine the human eye's response to light.
Tuesday, August 3, 2010
Sony DSC-50 Spectral Response to Incandescent Light
Recently I've been trying to measure the my digital camera's response to incandescent light. The camera is a DSC-50 Cybershot with which I tried to take pictures of the spectrum produced by a 100W incandescent light bulb seen through a Classroom Spectrometer from Edmund Scientifics. At first the images came out overexposed and the peaks of the sensitivity curves were clipped at the peaks. But I was able to tweak the settings on the camera to get a usable image.

The camera setting were 1600x1200, autofocus, spot metering and EV -2.0 (bias) for which the camera selected f/4.0 at 1/60 sec. Averging the RGB pixel values vertically along the spectrum gave the following response curves from the red, green and blue images. The averaging helps smooth the curves.
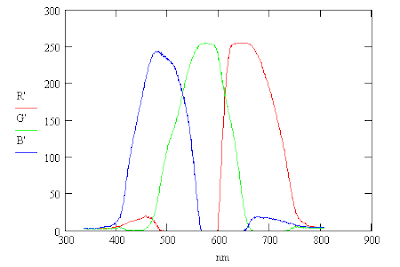
These RGB curves can be used to compute the corresponding intensity curve, I.
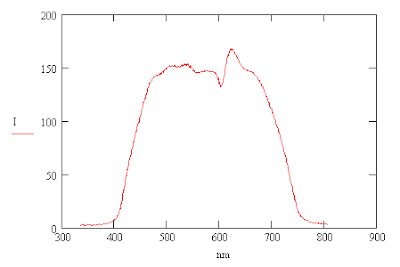
One can compute the intensity, I, from the RGB averages by using the following formula. The formula gives the same curve that one gets by converting the color image into a black and white image. Division by 3 is needed so that the intensity of white, R=255, G=255, B=255, is also equal to 255.
The light produced by an incandescent light bulb is primarily thermal radiation produced by a heated filament. The color temperature of the light is about 3000 °K and so it has more red light present than blue light. This may be why the red peak is higher than that of blue.

The camera setting were 1600x1200, autofocus, spot metering and EV -2.0 (bias) for which the camera selected f/4.0 at 1/60 sec. Averging the RGB pixel values vertically along the spectrum gave the following response curves from the red, green and blue images. The averaging helps smooth the curves.

These RGB curves can be used to compute the corresponding intensity curve, I.

One can compute the intensity, I, from the RGB averages by using the following formula. The formula gives the same curve that one gets by converting the color image into a black and white image. Division by 3 is needed so that the intensity of white, R=255, G=255, B=255, is also equal to 255.

The light produced by an incandescent light bulb is primarily thermal radiation produced by a heated filament. The color temperature of the light is about 3000 °K and so it has more red light present than blue light. This may be why the red peak is higher than that of blue.
edit: (12 Aug 2010) I made an error here. The values of the B&W image are the average of the RGB components.
Subscribe to:
Posts (Atom)