
Note that the number of days between the equinoxes can vary by as much as 25 days. The image below is from the Wikipedia article on Milankovitch cycles.
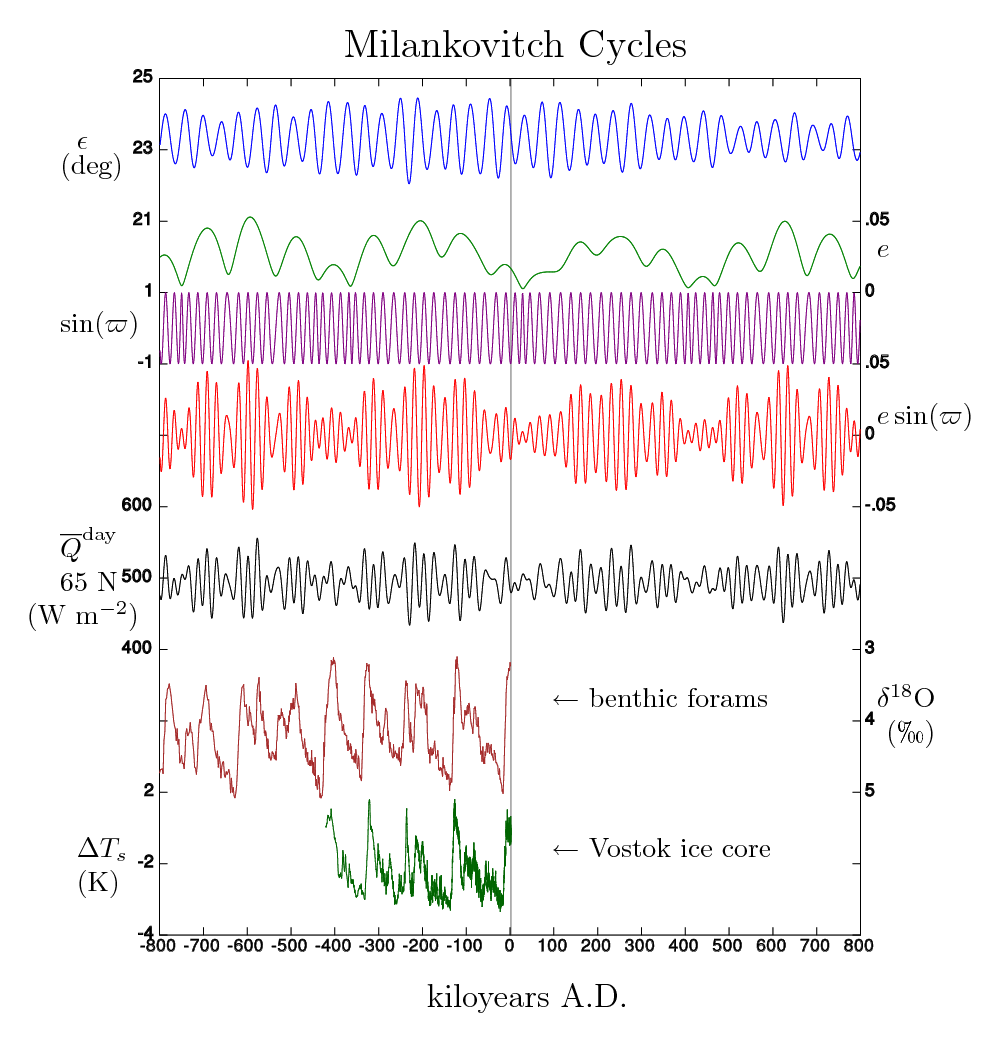
The first curve (blue) shows the changes in the Inclination of the Ecliptic, ε. The second curve (green) indicates the much slower changes in the Earth's eccentricity, e. And, the third curve (purple) gives the changes in the angle of perihelion.
Local heating depends on the angular distance of the Sun from the local zenith and so is a function of the Sun's apparent inclination and the number of hours of daylight. At any given time the Earth may not be exactly in equilibrium with the current heating conditions. Looking at the "number of days of heating" and the changes that are taking place might give a better picture of what is happening than one might get from the integrals in the Wikipedia article on insolation.
Supplemental (Aug 10): The calculation didn't take into consideration changes in the semi-major axis, a, which would affect the mean motion and the length of the year. In perturbation theory the semi-major axis is considered an adiabatic invariant. This would justify the first coefficient in the formula being a constant rather than a function of the eccentricity, e.
No comments:
Post a Comment